Quick summary:
One of the attractions of living in a big city is easy access to a large variety of local goods and services. But how much more variety do big cities offer? How do the specific varieties available differ in big and small cities? Why do bigger cities have greater variety? Does product variety simply increase proportionally to population?
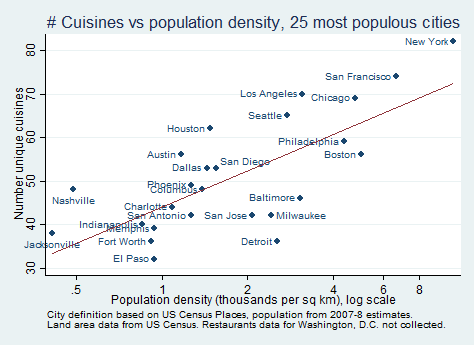
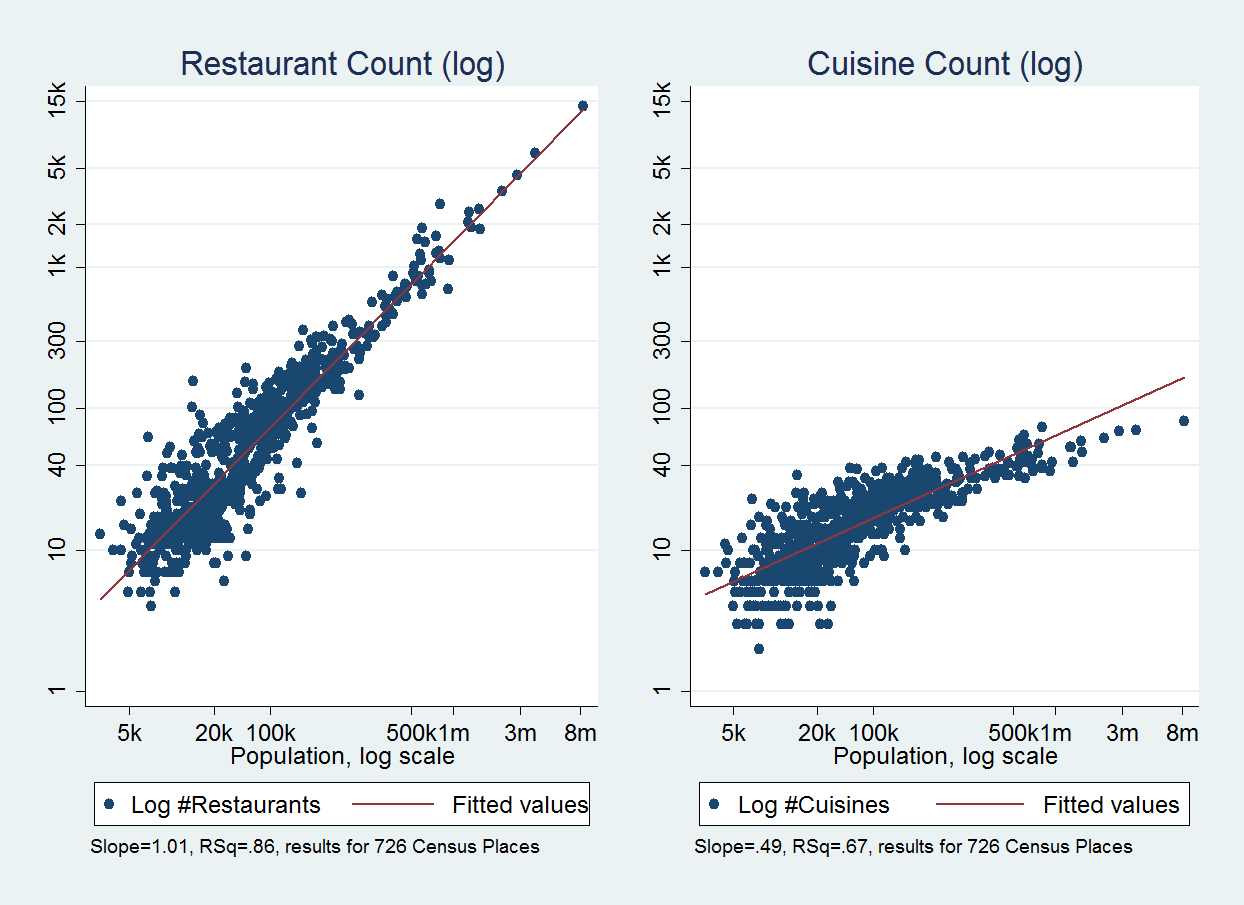
Restaurants are uniquely suited to studying questions like these. They are local goods, they are easily categorized into different varieties by cuisine, and they are an important component of a city’s attractiveness. In the graphs below I plot the number of unique cuisines in a city (Italian, Thai, Venezuelan, etc.) against the population of the city (graph 1) and the population density of the city (graph 2) for the top 25 most populous cities in 2008, the year of my data. In the first graph we can see that population is clearly a good indicator of cuisine count but there are a fair number of cities with quite a bit more cuisines (San Francisco, Seattle, Boston) or quite a bit fewer cuisines (Indianapolis, Jacksonville, Detroit) than is predicted by city population. In the second graph we can see that the cuisine count of some cities is actually better predicted by population density (Phoenix and Philadelphia is a nice example). This suggests that a city’s geography, in addition to its population, may have an important role in explaining product variety.
In this paper I argue that cities increase their variety of restaurants by providing greater demand, which allows the entry of restaurants with rarer cuisines, or cuisines preferred by a smaller percentage of people. Bigger cities have greater demand both because they have larger populations and because they concentrate their population into a smaller space, meaning restaurants in denser cities have more potential consumers nearby. This effect of population density can vary with the geographic size of the city so that the impact of both population and population density must be separately estimated. I use a unique dataset of over 127,000 restaurants across 726 cities in the year 2008 and estimate that a 1% increase in population increases a city’s cuisine count by 0.35-0.49%. Holding constant population, increasing a city’s population density by 1% increases a city’s cuisine count by an additional 0.16-0.21%. This could be thought of as fixing a city’s population but making everyone live closer together. Since large cities have many times the population and density of small cities, these effects can be important in magnitude. Further, I find that cities with greater restaurant variety tend to have all of the cuisines found in cities with lesser variety but also have rarer cuisines. This type of hierarchical pattern means that the specific cuisines in a city can be predicted quite well by the simple count of cuisines. All of these results hold after controlling for city demographics, such as ethnic diversity, income, education, and family size. I also perform analyses to show that the results are unlikely to be explained by confounding factors correlated with population and population density. The findings of this study not only confirm that bigger cities do indeed have much greater variety but that this variety itself is a direct consequence of city size and structure.
Additional details:
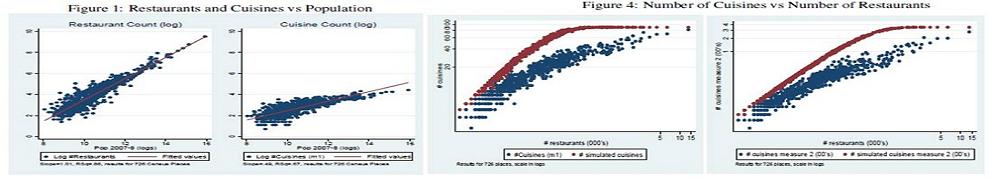
Below I graph the number of restaurants in a city against city population (left panel) and the number of cuisines in a city against city population (right panel). The left panel shows that restaurants increase almost exactly proportional to population: a 1% increase in a city’s population size is associated with a 1% increase in the number of restaurants in that city. The right panel shows that cuisines increase far more slowly with population and that a simple proportional relationship is not a great fit. This implies that simple measures like cuisines per capita or cuisines per restaurant will not accurately capture the relationship between city size and variety.
I now try to visually show the relationship between cuisine count, population, and population density in a single figure. Showing three variables makes the graph more complicated but the advantage is that it’s possible to see the effect of population density on cuisine count while holding constant population size. In the figure below the horizontal axis is population, the vertical axis is population density, and the height (“z-axis”) represents the number of cuisines. I plot the same 25 most populous cities as before to make the following two points:
- Cities with greater population have a larger number of cuisines. This can be seen by moving to the right along the horizontal axis and noting that the bars are getting taller. The number at the top of each vertical bar is the number of cuisines.
- Holding constant population, cities with greater population density have more cuisines. This can be seen by fixing a point along the horizontal axis and then moving up along the vertical axis and noting that the bars are getting taller.
